
Updated August 2026.
A restaurant website has one job during the busiest moment of the day: help a hungry guest see the menu and act. In August 2026, we changed the shared website platform behind Fleksa restaurant sites because that simple journey had become too slow and too expensive to serve at scale.
This is not a victory lap built around one green screenshot. It is a transparent restaurant website performance case study: where our lab scores started, what we changed, what improved, what broke, and what production taught us after the rollout.
The result in one minute
Before the final optimization pass, three mobile QA runs produced a median Lighthouse performance score of 87 for the homepage and 85 for the menu. After the critical rendering work, the same QA gate produced a median of 98 for the homepage and 100 for the menu. Desktop medians reached 100 on both routes.
| Route | Before: mobile median | After: mobile median | After: desktop median |
|---|---|---|---|
| Restaurant homepage | 87 | 98 | 100 |
| Full menu | 85 | 100 | 100 |
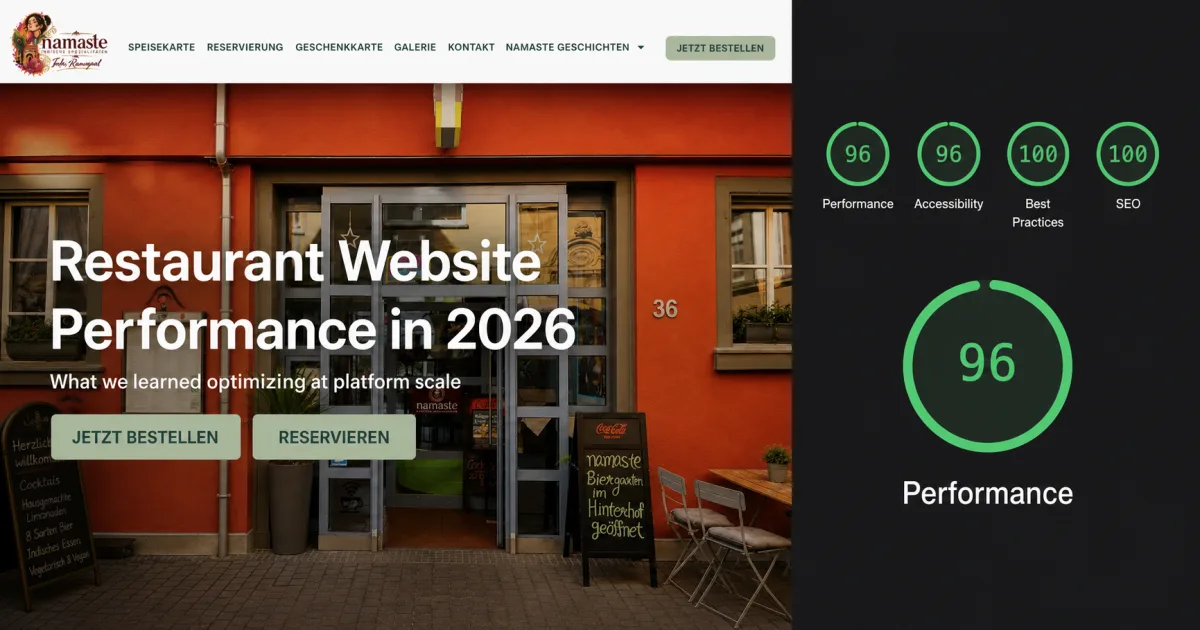
The test was successful, but production added an important qualification. In a three-site spot check after rollout, median mobile scores were 91 for Lali Son, 87 for Natkhat Flavors, and 80 for Namaste Aschaffenburg. A separate visible Namaste run scored 96 performance, 96 accessibility, 100 best practices, and 100 SEO. Both results are true. Lab tests vary, site content varies, and a single run is not a platform guarantee.
How we measured it
We used Lighthouse 13.4.1 in mobile mode and recorded three cold navigation runs per production homepage. We report the median rather than selecting the best score. Our QA performance gate also runs three times on homepage, menu, tag, and location templates across mobile and desktop.
- Date: 17 August 2026.
- Lab metrics: Lighthouse performance, Largest Contentful Paint, Cumulative Layout Shift, Total Blocking Time, and server response time.
- Production sample: lalisonfastfoods.com, natkhatflavors.com, and namaste-aschaffenburg.de.
- Limitation: these pages did not have usable Chrome UX Report field data in our test, so the numbers below are lab observations, not real-user percentiles.
This distinction matters. Google recommends using Core Web Vitals to evaluate page experience, while also warning that good tool scores do not guarantee high rankings. Performance is one part of a useful page, not a shortcut around relevance and quality. See Google's page experience guidance.
Where the time was going
The first assumption was server overload. The evidence pointed elsewhere. QA server response times were generally a few hundred milliseconds, while homepage and menu routes shipped much more HTML and JavaScript than lightweight search pages. The menu could receive its critical content early and still wait on the browser to parse, hydrate, and render the full application shell.
Five costs repeated across restaurant sites:
- Duplicate data work. The server had already supplied menu data, then the browser requested overlapping data again.
- A heavy shared shell. Navigation, footer, SEO components, icons, translations, and ordering utilities arrived on the first render even when they were not immediately needed.
- Oversized serialized state. Restaurant, menu, checkout translations, and fallback-language content increased HTML size.
- Non-critical scripts on the critical path. Consent and other enhancements competed with the content a guest came to see.
- Unstable media dimensions. Logos and dynamic sections could move already-painted content, hurting Cumulative Layout Shift.
What made the measurable difference
We stopped repeating work
The homepage now uses the menu data it already received instead of immediately repeating the same full-menu request. Search-oriented routes no longer perform full-sitemap validation for each request. These changes reduce both visitor latency and avoidable pressure on the shared backend.
We deferred code that did not earn its place above the fold
The cookie-consent library and stylesheet now load only when the banner is eligible to appear. Interactive navigation and other non-critical behavior are separated from the first useful render. The goal was not less functionality; it was to stop making every guest download every capability before seeing the restaurant.
We treated image geometry as performance work
Hero images received accurate responsive sizing. Logo containers and featured areas reserve their final space before assets arrive. This improves visual stability without hiding content or replacing the design with a generic lightweight page.
We kept the real menu
Our first attempt used a simplified menu during the transition to the interactive ordering experience. It was fast, but the visual handoff felt like two different products. We removed it. The production menu now renders a useful server preview and restores the complete interactive menu automatically. Guests do not need to press a Load more button.
That decision is central to the result: performance is not successful when the score improves by removing the experience people came for.
What production taught us after the green build
The production sample showed why performance work needs a loop rather than a launch day.
| Site | Three mobile scores | Median score | Median LCP | Median CLS |
|---|---|---|---|---|
| Lali Son | 91, 97, 70 | 91 | 3.3 s | 0.012 |
| Natkhat Flavors | 87, 95, 55 | 87 | 4.0 s | 0.036 |
| Namaste Aschaffenburg | 87, 80, 70 | 80 | 4.7 s | 0.081 |
Median server response times remained healthy at roughly 193–428 ms. The biggest outliers were browser-side: an intermittent logo/footer layout shift on Lali Son and Natkhat Flavors, and slower hero rendering on Namaste. That is useful because it tells us where the next engineering hour should go. Adding server capacity would not address either problem.
Six lessons worth carrying into any restaurant platform
- Measure templates, not one homepage. A restaurant platform includes homepage, menu, location, checkout, and content routes.
- Use repeated medians. One 96 proves the page can be fast; it does not prove every visit will be fast.
- Do not trade away the product. A fast placeholder followed by a jarring application swap is not a good guest experience.
- Server load and page speed are related, not identical. Measure response time and browser rendering separately.
- CLS can destroy an otherwise fast run. Reserve space for logos, heroes, banners, and asynchronously restored content.
- Performance needs an automated gate. The safest optimization is the one that fails the build when it regresses.
What this means for restaurant owners
You should not need to understand React hydration or cache headers to own a fast restaurant website. You should be able to open the menu on a real phone, see content immediately, scroll without the page jumping, and order without being redirected into a different product.
That is the standard Fleksa is building toward across the shared platform. Read why restaurant website speed affects orders, search, and AI discovery, then use our restaurant website speed checklist to audit your own site.
Want a restaurant website with ordering on your own domain? Explore the Fleksa restaurant website platform or book a walkthrough.

